
Google Analytics is one of the best tools to use when analyzing your website traffic. It provides in depth data on your viewers and allows you to make sure your pages are performing optimally. The tool has a lot of capabilities; we’ve provided a brief description on how to use Google Analytics to track and report website traffic.
Home Tab
The first thing you see when you log into your Google Analytics account is your home screen. This tab has a table listing the websites set up in your account with some quick stats. The first statistic is the number of sessions, or the number of times users engaged with your website. This is followed by average session duration, or the average length of time a user is engaged on your website. Next is the bounce rate, or the percentage of users who visited your home page and left without further interaction with the website. Ideally, you want this number to be as low as possible. Lastly is the goal conversion rate, this is calculated as goal completions, divided by sessions, multiplied by 100. You can also adjust the date range of the data presented in the upper right hand corner of the page.

Reporting Tab
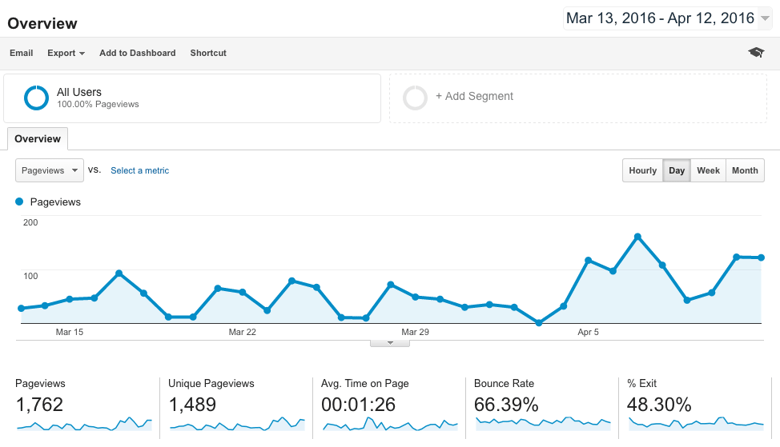
The next tab contains all of that juicy data that Google Analytics is known for. A slide menu on the left side of the page allows you to navigate easily. The first two categories are the dashboard and shortcuts, which allow you to customize your dashboard and personal shortcuts. We’ve described the next few categories in full below.
Intelligence Events
This section allows you to set email notifications for certain events. Events could be a dramatic change in sessions or goal conversions, in fact, they can include any metrics you want. The events can be set up for a daily, weekly, or monthly timeframe and viewed prospectively.

Real-Time
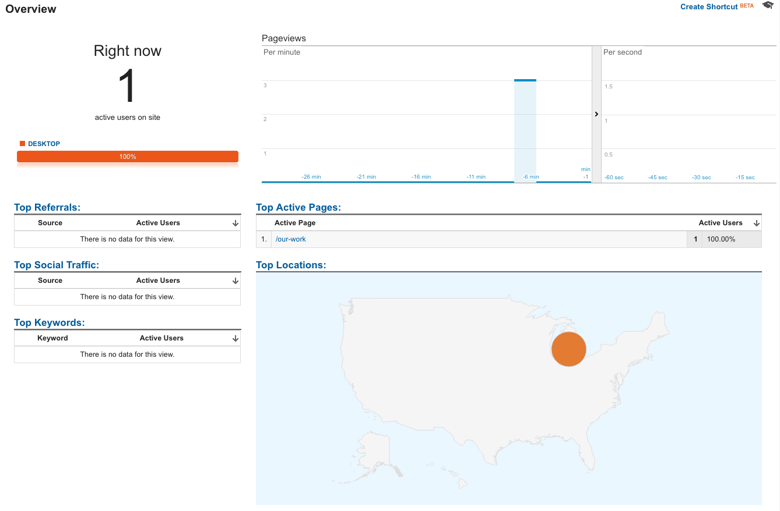
As the name implies, this section gives you access to the data of real-time viewers. In the upper left hand corner is a big number displaying the active users you have at that very moment. The number is broken down below as a percentage of the different devices your viewers are using to access your page. It also gives the number of page views you received in the past 30 minutes and the last 60 seconds. Lastly, it displays a map showing where in the world your current viewers are located.
Audience
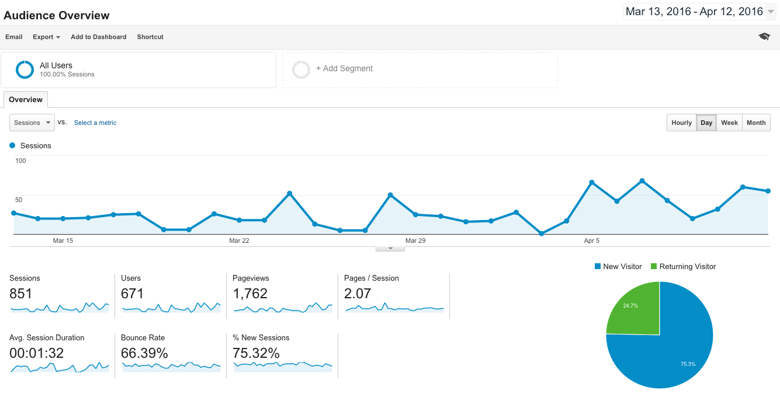
This section of the reporting tab contains all of your viewers’ demographic and personal information. In the overview page of this section, you can view some new statistics, including the percentage breakdown of new and returning visitors, visitor language spoken, and location. You can also see the percentage breakdown of the browser used, the operating system, and the service provider for both desktop and mobile. The tabs under the “Audience” section for each of the statistics give a more in depth look than the overview page.
Acquisition
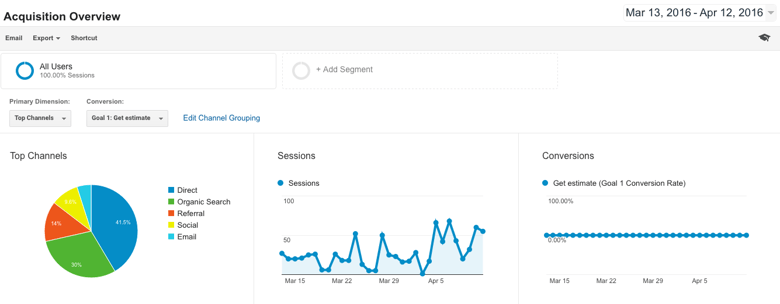
This page is an overview of your channels and sources. It allows you to see how your viewers are getting to your page. A customizable pie chart is included, which shows your top channels (i.e. direct, organic search, email, social, etc.), and top sources (i.e. direct, google, Facebook, Twitter etc.). The chart below gives the breakdown of the number of sessions, the bounce rate, and the conversion rate for each of the channels or sources. The tabs in the “Acquisition” section give even more in depth data on each of these different categories.
Behavior
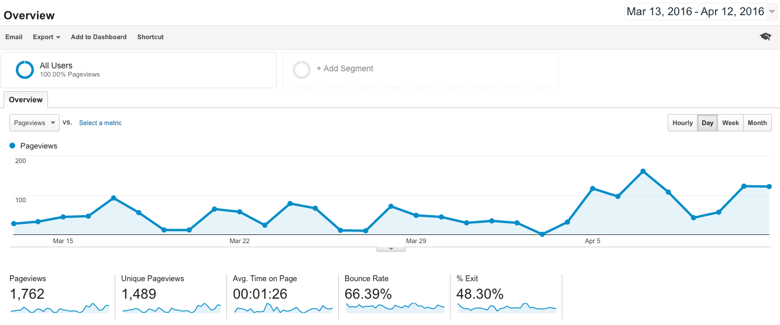
The Behavior section takes a look at data for the individual pages on your site. It gives you all sorts of information for each page, such as page views, average time on page, entrances, bounce rate, etc. There is also a “Behavioral Flow” section under “Behavioral” that gives a flow graphic of the paths viewers take within your website. It shows where they start, what paths they take throughout, and which pages they view last before they decide to navigate away from your site. You can drag your mouse over each page and the number of sessions, through traffic percentage, and drop-off percentage will appear.
Customization Tab
This section allows you to customize a report and email it regularly to contacts of your choice. There are plenty of charts, graphs, and reports in the “Reporting” tab, but this allows you to customize the exact data you find fit. Each of your reports will show up as a link on the home screen of the tab, as well as in the side menu on the left side of the page.

Admin Tab
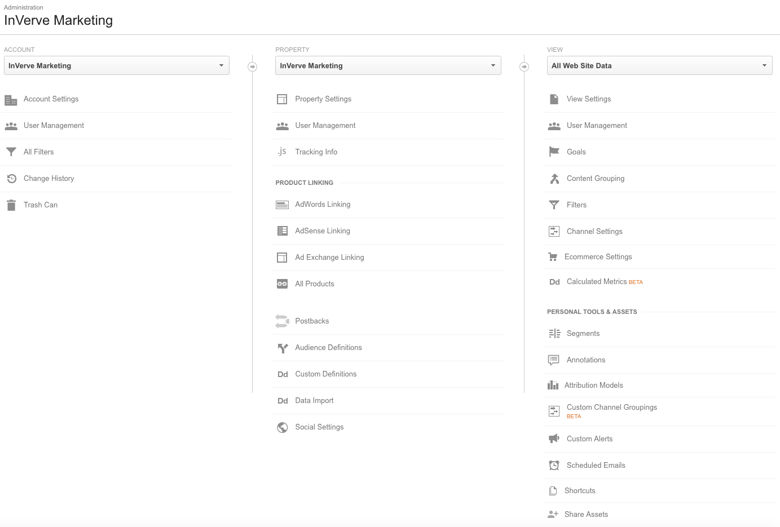
The last tab is the Admin tab. This tab is where you manage all of the settings. The most important thing to focus on with this tab is the “Goals” section. This tool helps you track the data related to a user completing a specific action on your website. This area is important for marketers because it allows them to stay on top of their website and what they want to accomplish.
Google Analytics can be a very powerful tool for your company. Use it to truly understand which aspects of your website are speaking to your customers and which ones are turning them off. Learn from what the data is telling you, adjust and optimize your website...and get the results you want.
Topics: marketing


